Debugging
There are four main ways to debug an openFrameworks application.
Table of Contents
cout Debugging
The easiest way to quickly debug a sketch is to use cout to output the state of your variables to the terminal window that opens along with your sketch.
Downsides: The output can be overwhelming and will slow down your sketch.
ofLog Debugging
The ofLog class is slightly more powerful than cout debugging as it allows for log levels and the possibility of writing log messages to a file.
Downsides: Same as cout debugging.
drawString() Debugging
This is similar to cout debuggging, but instead you use a true type font to draw the state of certain variables to the screen.
Downsides: Variables state output in this way will be overwritten every frame.
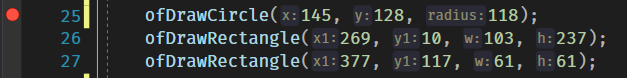
Breakpoint Debugging
You can add one or more breakpoints by clicking in the breakpoint column to the left of your code. The breakpoints will show as red circles and can be clicked again to be removed.
The execution of your code will now pause when a breakpoint is reached. You can then step into (F11), step over (F10), and step out (Shift-F11) to walk through your code line by line. There are buttons for these step-types as well:

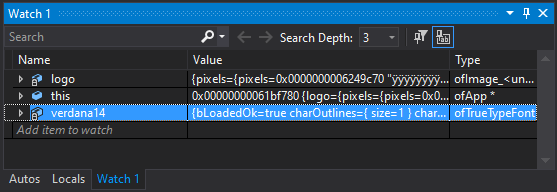
The state of local variables is shown below. You can add your own variables to watch as well.