Drawing Shapes
Drawing 2D shapes to an HTML canvas with p5.js is a snap.
Table of Contents
- The Canvas
- Canvas Size
- Drawing Points and Lines in 2D
- Drawing 2D Shapes
- Colour
- Lines and Shape Strokes
- Shape Fill
- Background Colour
- Translation, Rotation, and Scaling
- Shape Example - Twisted Squares
The Canvas
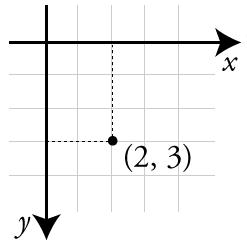
When working in 2D, the canvas can be consider to be a grid of pixels. This is similar to the x/y cartesian coordinates used in high-school algebra, but with a few changes:
- The origin (where x and y are zero) is in the top left corner of the screen.
- The y-axis is flipped such that values of y increase as you go down the screen.
The image to the right shows a dot at x = 2 and y = 3.
Resources
Canvas Size
By default, the size of the canvas is 100 (width) by 100 (height) pixels. The size of the canvas can be changed in setup() using 📜 createCanvas():
createCanvas(400, 300); // Create a canvas 400 pixels wide and 300 pixels high.
There are special global variables that store the canvas 📜 width and 📜 height:
circle(width / 2, height / 2);
Drawing Points and Lines in 2D
We can draw a pixel at any point and a line between any two points on the canvas:
point(50, 100); // A point at x = 50 and y = 100.
strokeWeight(5); // If not set, line thickness is set to 1 pixel.
line(0, 0, width, height); // Line from top left to bottom right corners.
Anti-aliasing of lines is enabled by default but can be toggled using 📜 smooth() and 📜 noSmooth.
Resources
Drawing 2D Shapes
There are a number of methods that allow you to draw 2D shapes to the canvas:
- 📜
arc()- Portions of a circle. - 📜
ellipse()- Squished circles. - 📜
circle()- Plain old circles. - 📜
quad()- Four point quadrilateral polygon. - 📜
rect()- Rectangle. - 📜
square()- Square. - 📜
triangle()- Triangle.
Resources
- 🚂 2D Shapes and the Canvas - The Coding Train (25m46s)
- 🏷️ Shape Primitives Examples
- 📜 Custom Shapes with
beginShape(),vertex(), andendShape() - 🏷️ Building Stars with
beginShape(),vertex(), andendShape() - 🔰 Arcs, Spline Curves, and Bézier Curves Guide
Colour
We can create color variables in a variety of ways using the 📜 color() function.
let greyish = color(200); // Greyscale from 0 (black) to 255 (white).
let reddish = color(230, 30, 90); // R, G, B values from 0 to 255.
let red = color("red"); // CSS color names are supported.
let oneMore = color("#FA55B4"); // Hexadecimal RGB notation too.
Alpha values can be used to create colours with a 0-255 level of transparency, where 0 is fully transparent and 255 is fully opaque.
let ghostlyRed = color(255, 0, 0, 127); // Red, 50% transparent
let translucentBlank = color(0, 127); // Black, 50% transparent.
Resources
- 🚂 Color in p5.js - Coding Train (13m38s)
- 🔰 An Introduction to Digital Color
- 📜
colorMode- Using HSB and HSL Colors - 🏷️ Color Variables Examples
- 🏷️ Gradient Colour with
lerpColor()Examples
Lines and Shape Strokes
We set the color of lines and shape outlines using 📜 stroke()
We use 📜 strokeWeight() to set the thickness of shape outlines.
We use 📜 noStroke() to disable shape outlines.
let ghostlyRed = color(255, 0, 0, 127); // Red, 50% transparent
stroke(ghostlyRed); // Stroke set using a color variable.

// Also takes the same color arguments as color():
stroke(200); // Greyscale color from 0 (black) to 255 (white).
stroke(255, 0, 0); // R, G, G values from 0 to 255.
stroke("#FA55B4"); // Hexadecimal RGB notation too.
stroke(0, 127); // Black, 50% transparent.
Shape Fill
We set the fill color of shapes using 📜 fill().
We use 📜 noFill() to disable shape fill.
let ghostlyRed = color(255, 0, 0, 127); // Red, 50% transparent
fill(ghostlyRed); // Stroke set using a color variable.

// Also takes the same color arguments as color():
fill(155); // Another greyscale value.
fill("red"); // CSS color names are supported.
fill(255, 0, 0, 127); // Red, 50% transparent
Background Colour
It’s our responsibility to clear the canvas at the start of every frame. We do this using 📜 background(), which can take a color variable, or the same color arguments as color(), fill(), or stroke().
void draw() {
  background(50, 90, 200, 255); // Clear background with R, G, B, A (0-255)
  circle(width / 2, height / 2, 50, 50); // Circle draws over background.
}
🎵 Note:
Interesting trailing effects can be made using backgrounds with alpha transparency.
Translation, Rotation, and Scaling
We can change the position, scale, and rotation of the coordinate system using a variety of translate and rotate methods.
translate(200, 200); // Move the origin to (200, 200)
rotate(PI / 4); // Rotate coordinate system by 45 degree (around z)
rectangle(0, 0, 100, 100); // Draw a diamond.
We can also save and restore the state of the coordinate system using push() and pop().
stroke(0, 200, 0); // Green stroke color.
push(); // Save the original unrotated coordinate system with origin top left.
strokeWeight(5); // 5 pixel stroke width.
stroke(200, 0, 0); // Red stroke color.
translate(100, 50); // Move the origin to (100, 50)
rotate(PI / 4); // Rotate coordinate system by PI/4 radians (45 degrees).
scale(2, 2); // Double the scale.
rect(0, 0, 50, 50); // Draw a red diamond with thick lines.
pop(); // Restore the original drawing styles and coordinate system.
rect(5, 5, 50, 50); // Draw a green square with a thin lines near top left corner.
⚡ Warning:
translate, rotate, and scale are cumulative within draw() but reset each frame.
Edit Code Using p5.js Web Editor
The Result:
Resources
- 📜
translate()- Change the location of the origin. - 📜
rotate()- Rotate the coordinate system. - 📜
scale()- Scale the coordinate system and the stroke weight. - 📜
push()- Saves current drawing styles and coordinate transformation, rotation, and scale. - 📜
pop()- Restore settings saved bypush(). - 🏷️ Translate Example
- 🏷️ Scale Example
- 🏷️ Rotate Example
- 🏷️ Translate / Rotate Arm Example
Shape Example - Twisted Squares
Here’s an example that shows off some possibilities with shapes, colors, scale, and rotation.
function setup() {
  createCanvas(400, 400);
  rectMode(CENTER); // Rectangle positions point to the center, not top corner.
  noFill(); // Don't fill shapes.
}

function draw() {
  background(255); // Clear the screen with white.
  translate(width / 2, height / 2); // Translate to center of sketch.

  // Calculate scale and rotation.
  let scaleFactor = map(constrain(mouseX, 0, width), 0, width, 1.1, 1.5);
  let rotation = map(constrain(mouseY, 0, height), 0, height, 0, PI / 8);

  // Draw 60 circles of increasing size and rotation.
  let maxSquares = 60;
  for (let i = 1; i < maxSquares; ++i) {
    rotate(rotation); // The x position of the mouse mapped 0 to PI/8 sets the rotation.
    scale(scaleFactor); // The y position of the mouse mapped 1.1 to 1.5 sets the scale.
    strokeWeight(1 / (scaleFactor * i)); // Stroke weight shouldn't increase as we scale.
    // Color transitions from pink to blue as squares grow in size.
    stroke(lerpColor(color("DeepPink"), color("DeepSkyBlue"), i / maxSquares));
    rect(0, 0, 4, 4); // Draw the rotated and scaled square.
  }
}
⏳ Wait For It:
We’ll learn more about mouse input, 📜 map(), and 📜 constrain() next.
Edit Code Using p5.js Web Editor
The Result: